Every protocol, one pipeline
Collect across the whole estate — SNMP, gNMI, NetFlow/sFlow, BMP, syslog — through one drag-and-drop pipeline. Route it where you need, or keep it entirely onprem.
Find the device that broke first in seconds, with nothing leaving your network. Full-stack telemetry,In-built copilot, AI detection and topology-aware root cause, all self hosted.
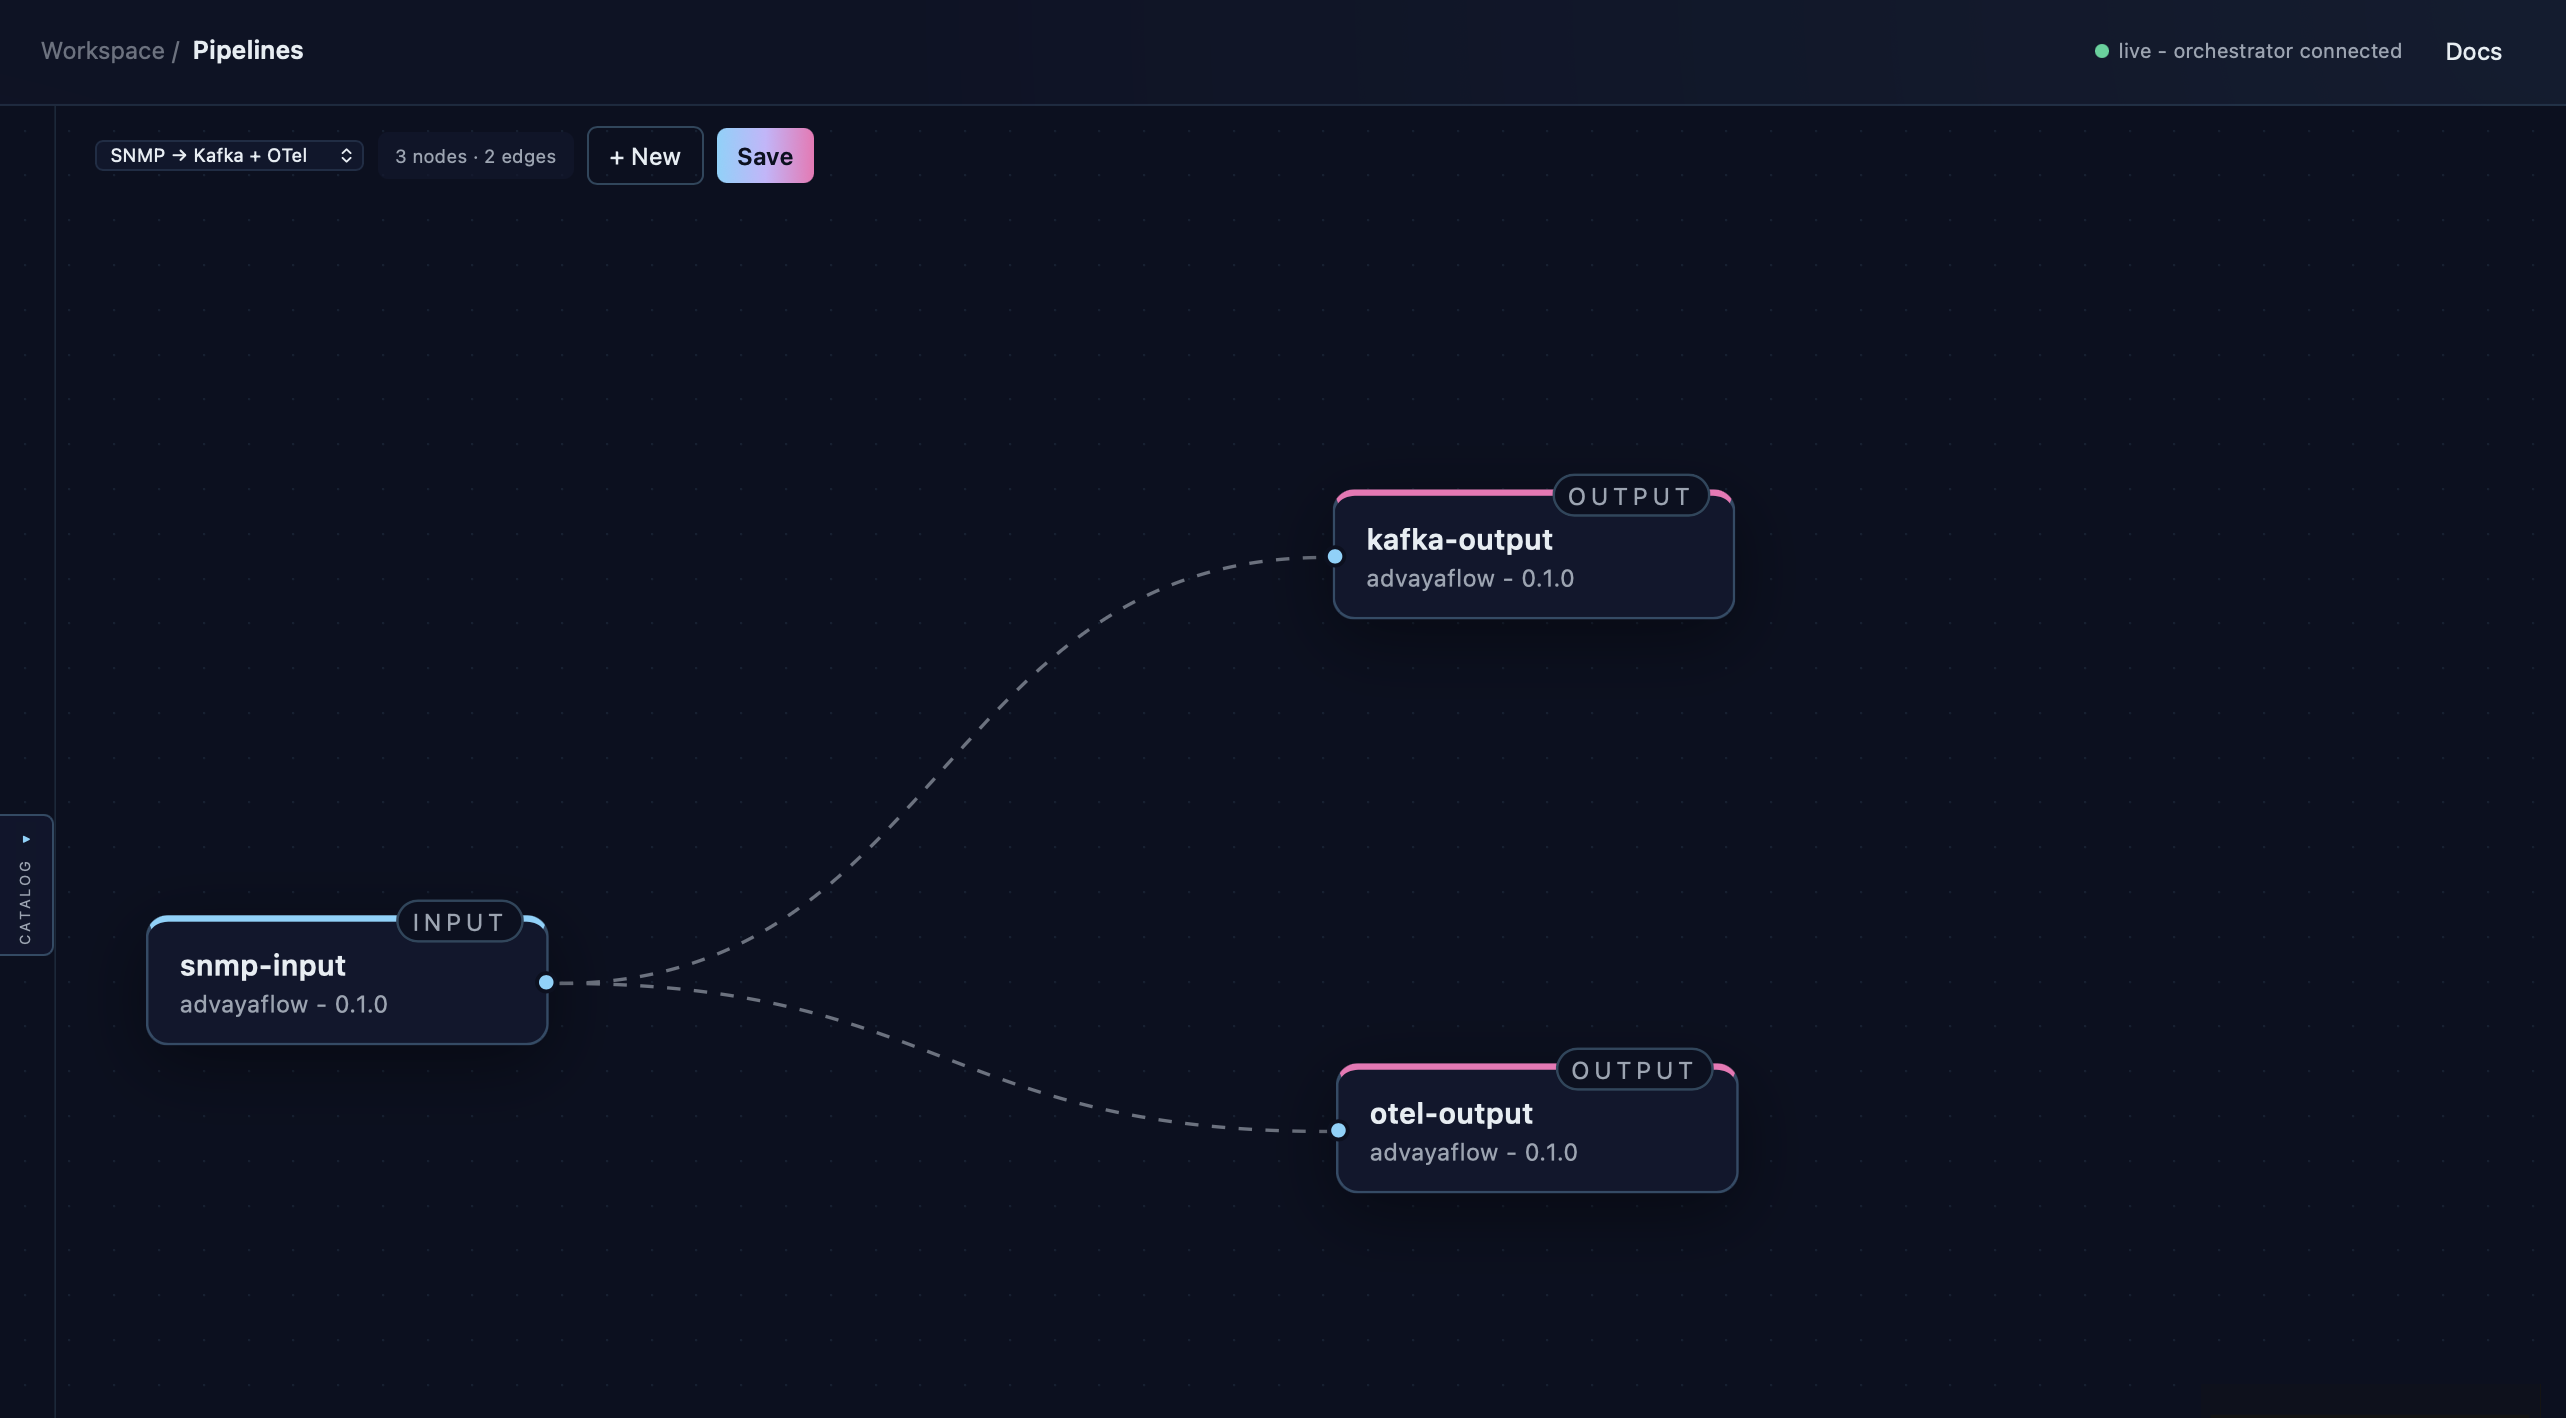
Drag inputs, transforms and outputs onto the canvas and wire them together. Send SNMP to Kafka and OpenTelemetry at once — changes apply live against the orchestrator, no config files to hand-edit.
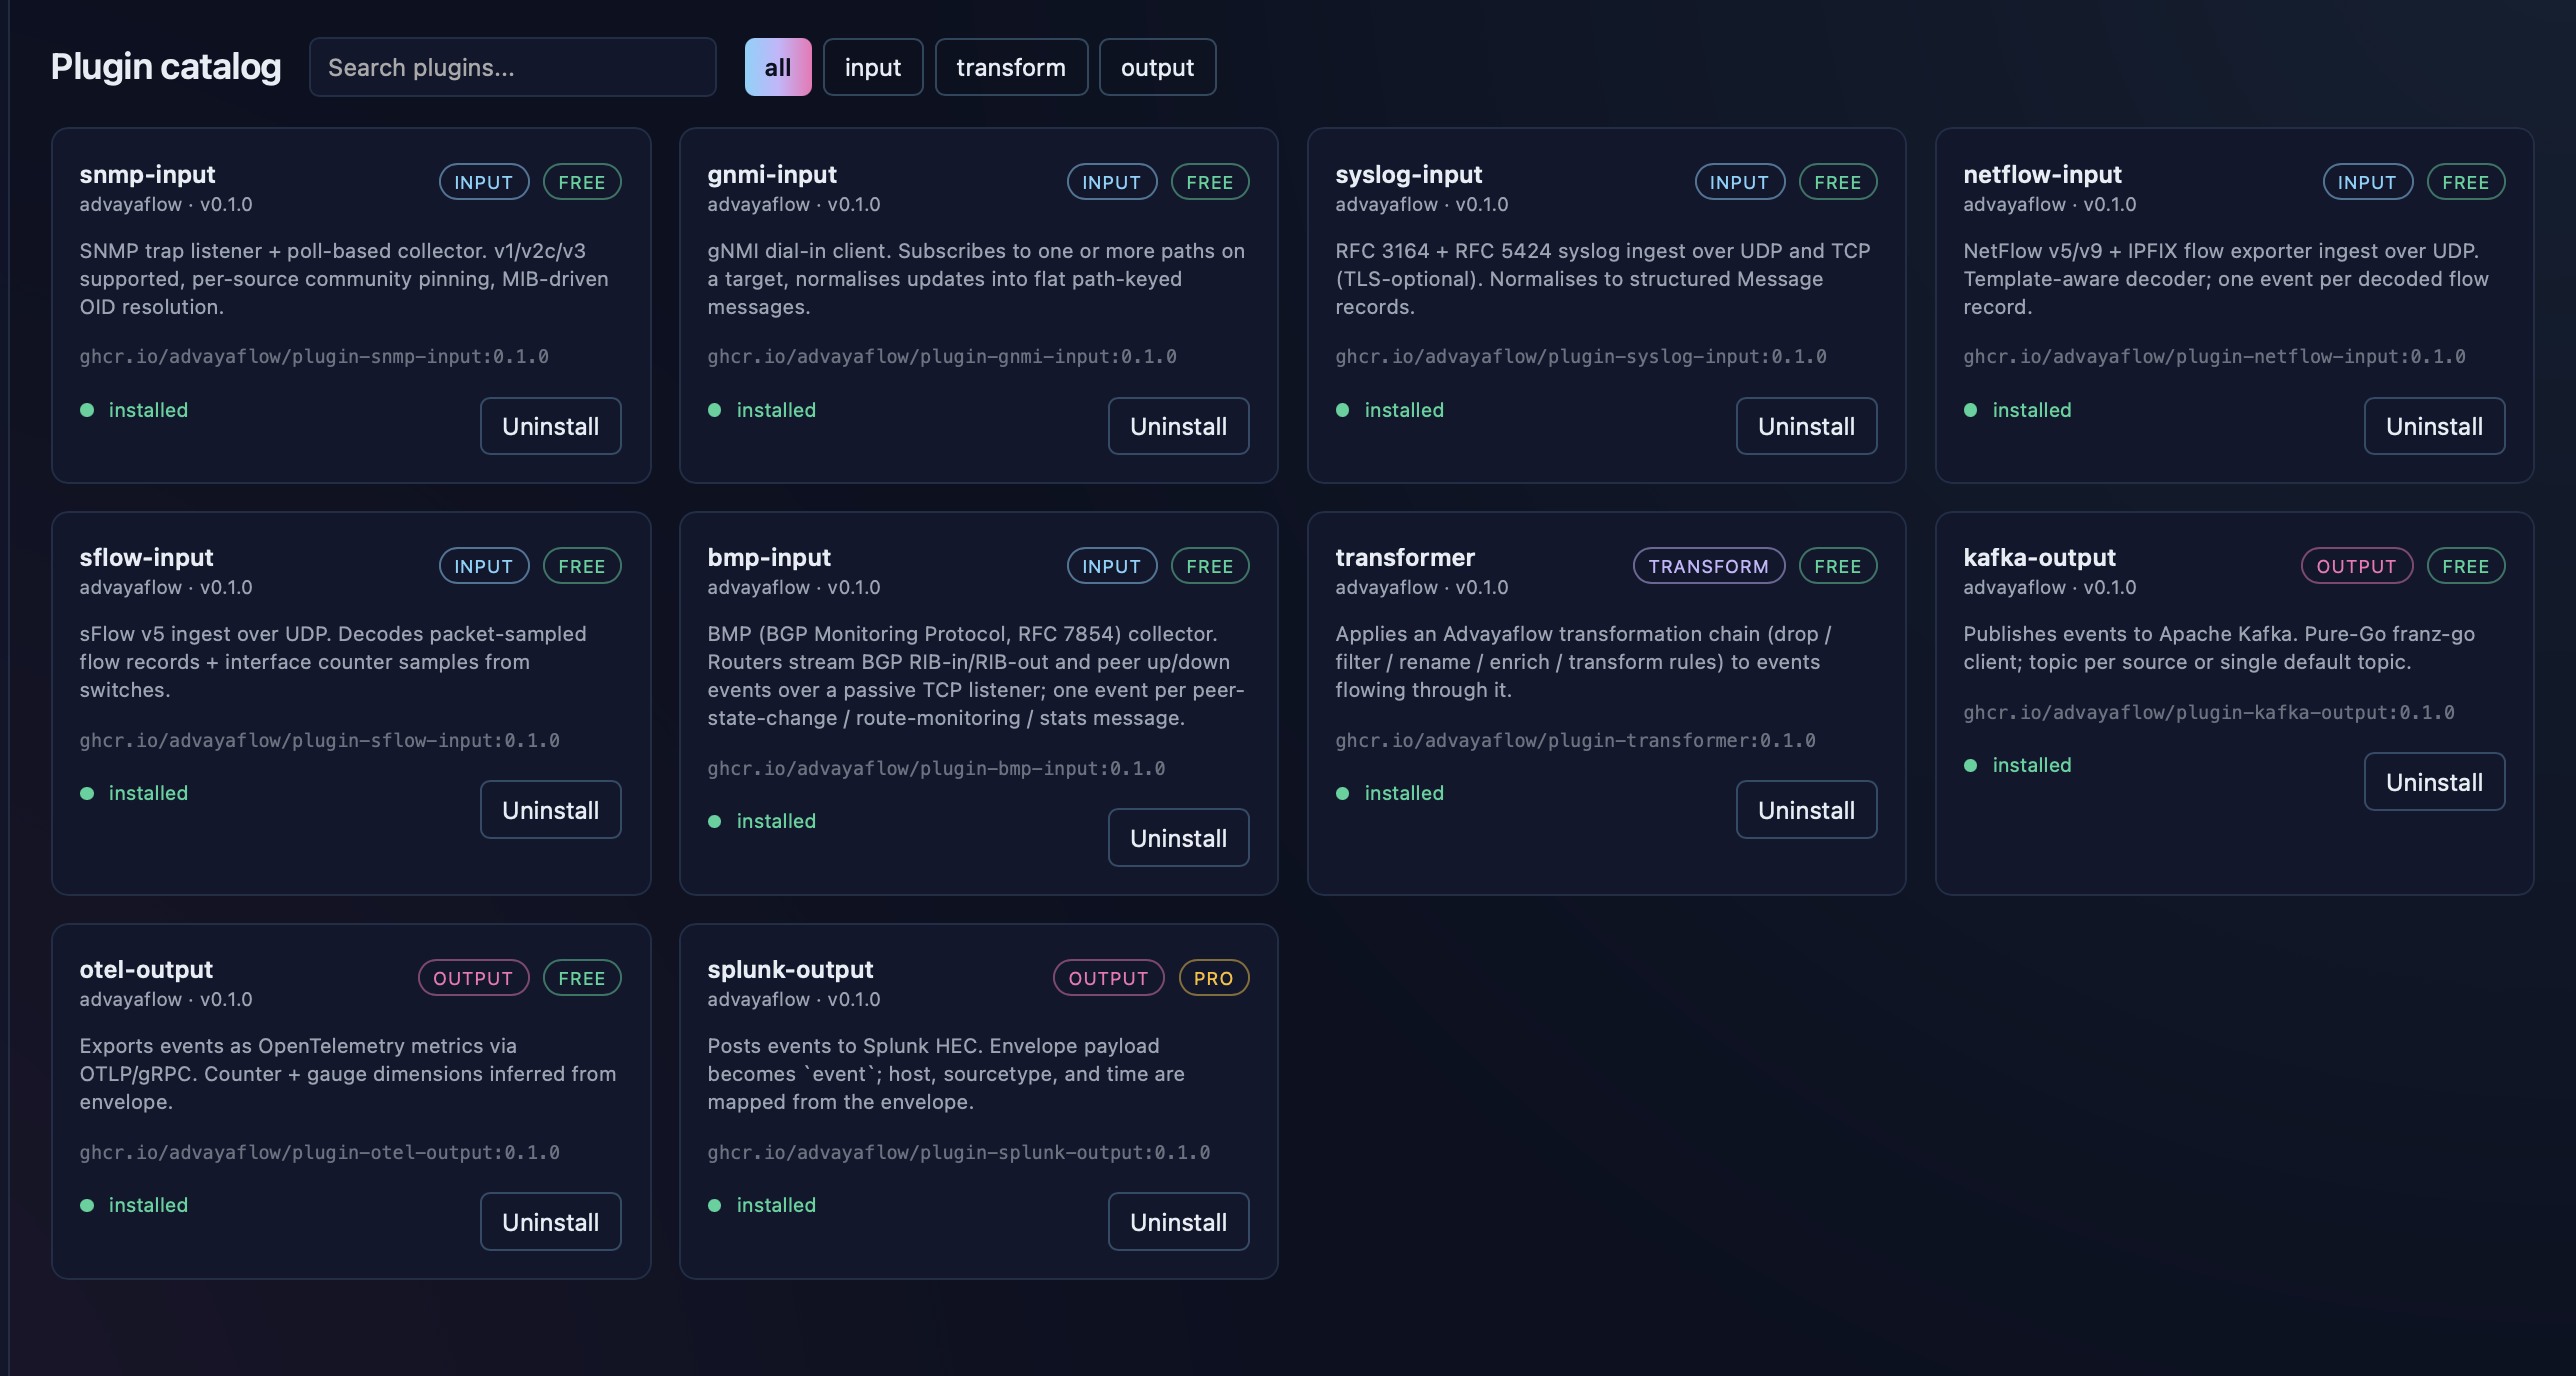
Pick from inputs — SNMP, gNMI, syslog, NetFlow, sFlow, BMP — plus transforms and outputs like Kafka, OpenTelemetry and Splunk. Install or remove any of them in one click, and we ship new plugins constantly.
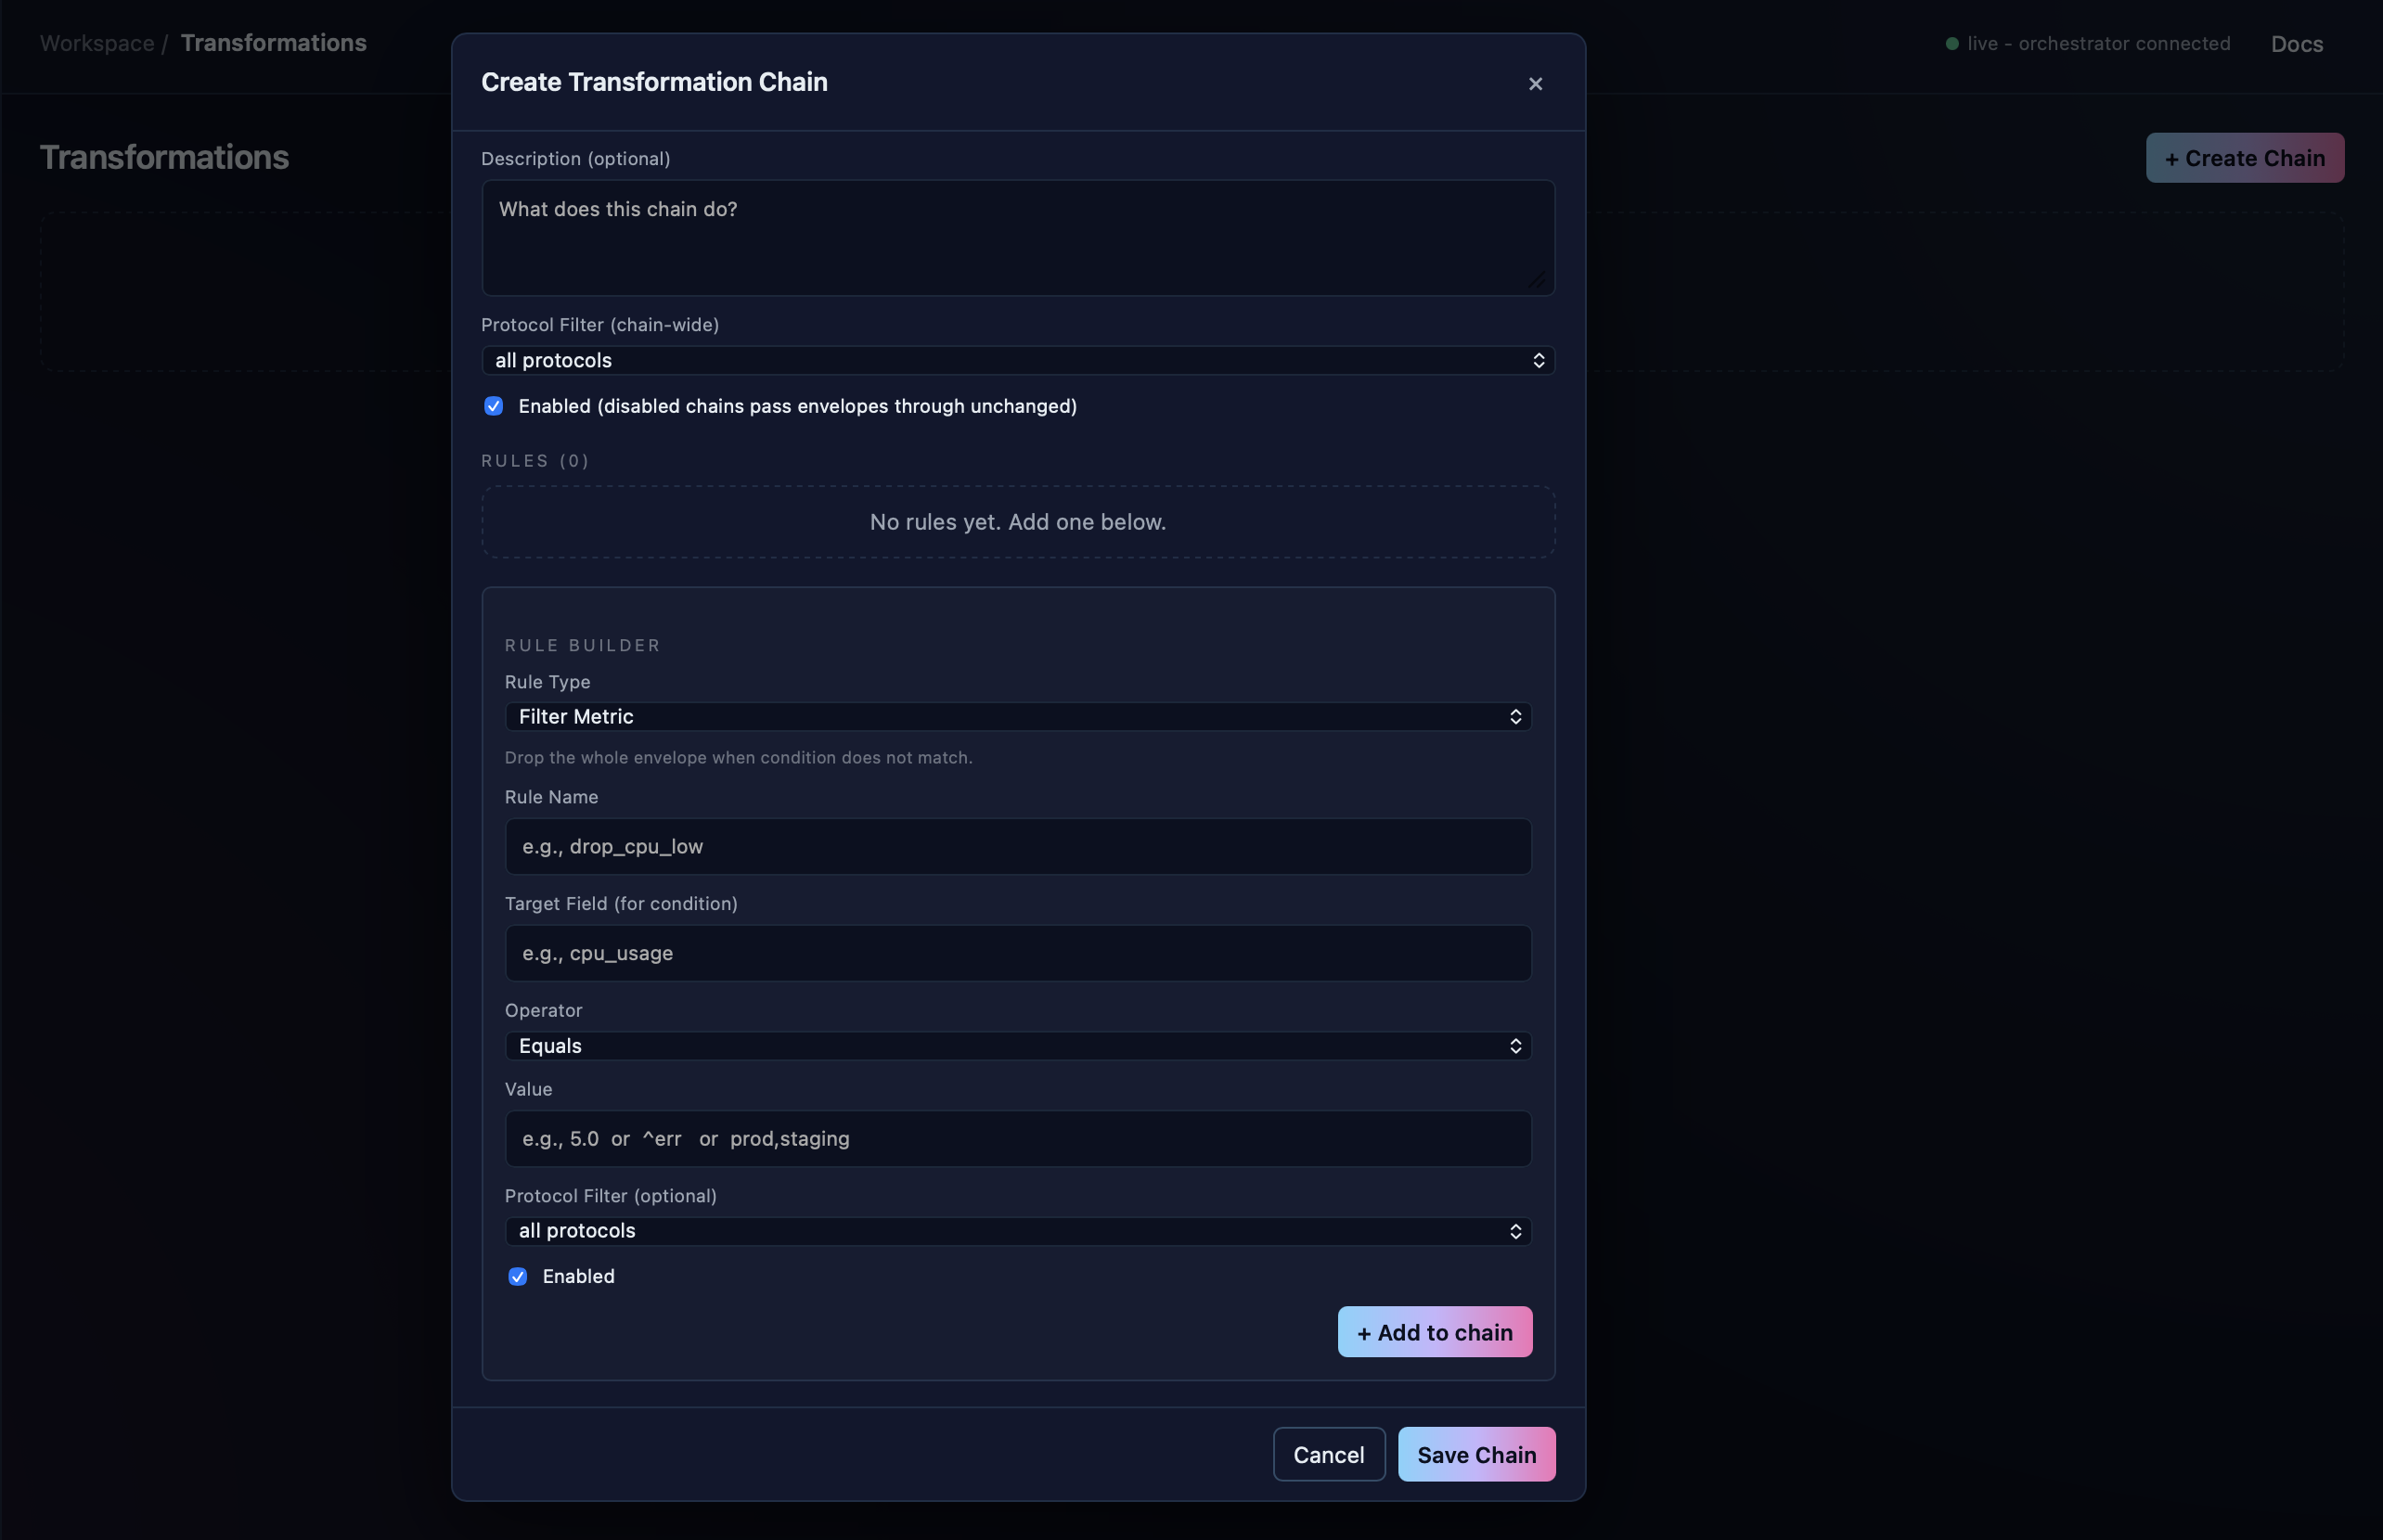
Build transformation chains with a visual rule builder — drop, filter, rename, enrich — scoped per protocol. Trim noise and normalise fields before anything reaches your store or your bill.
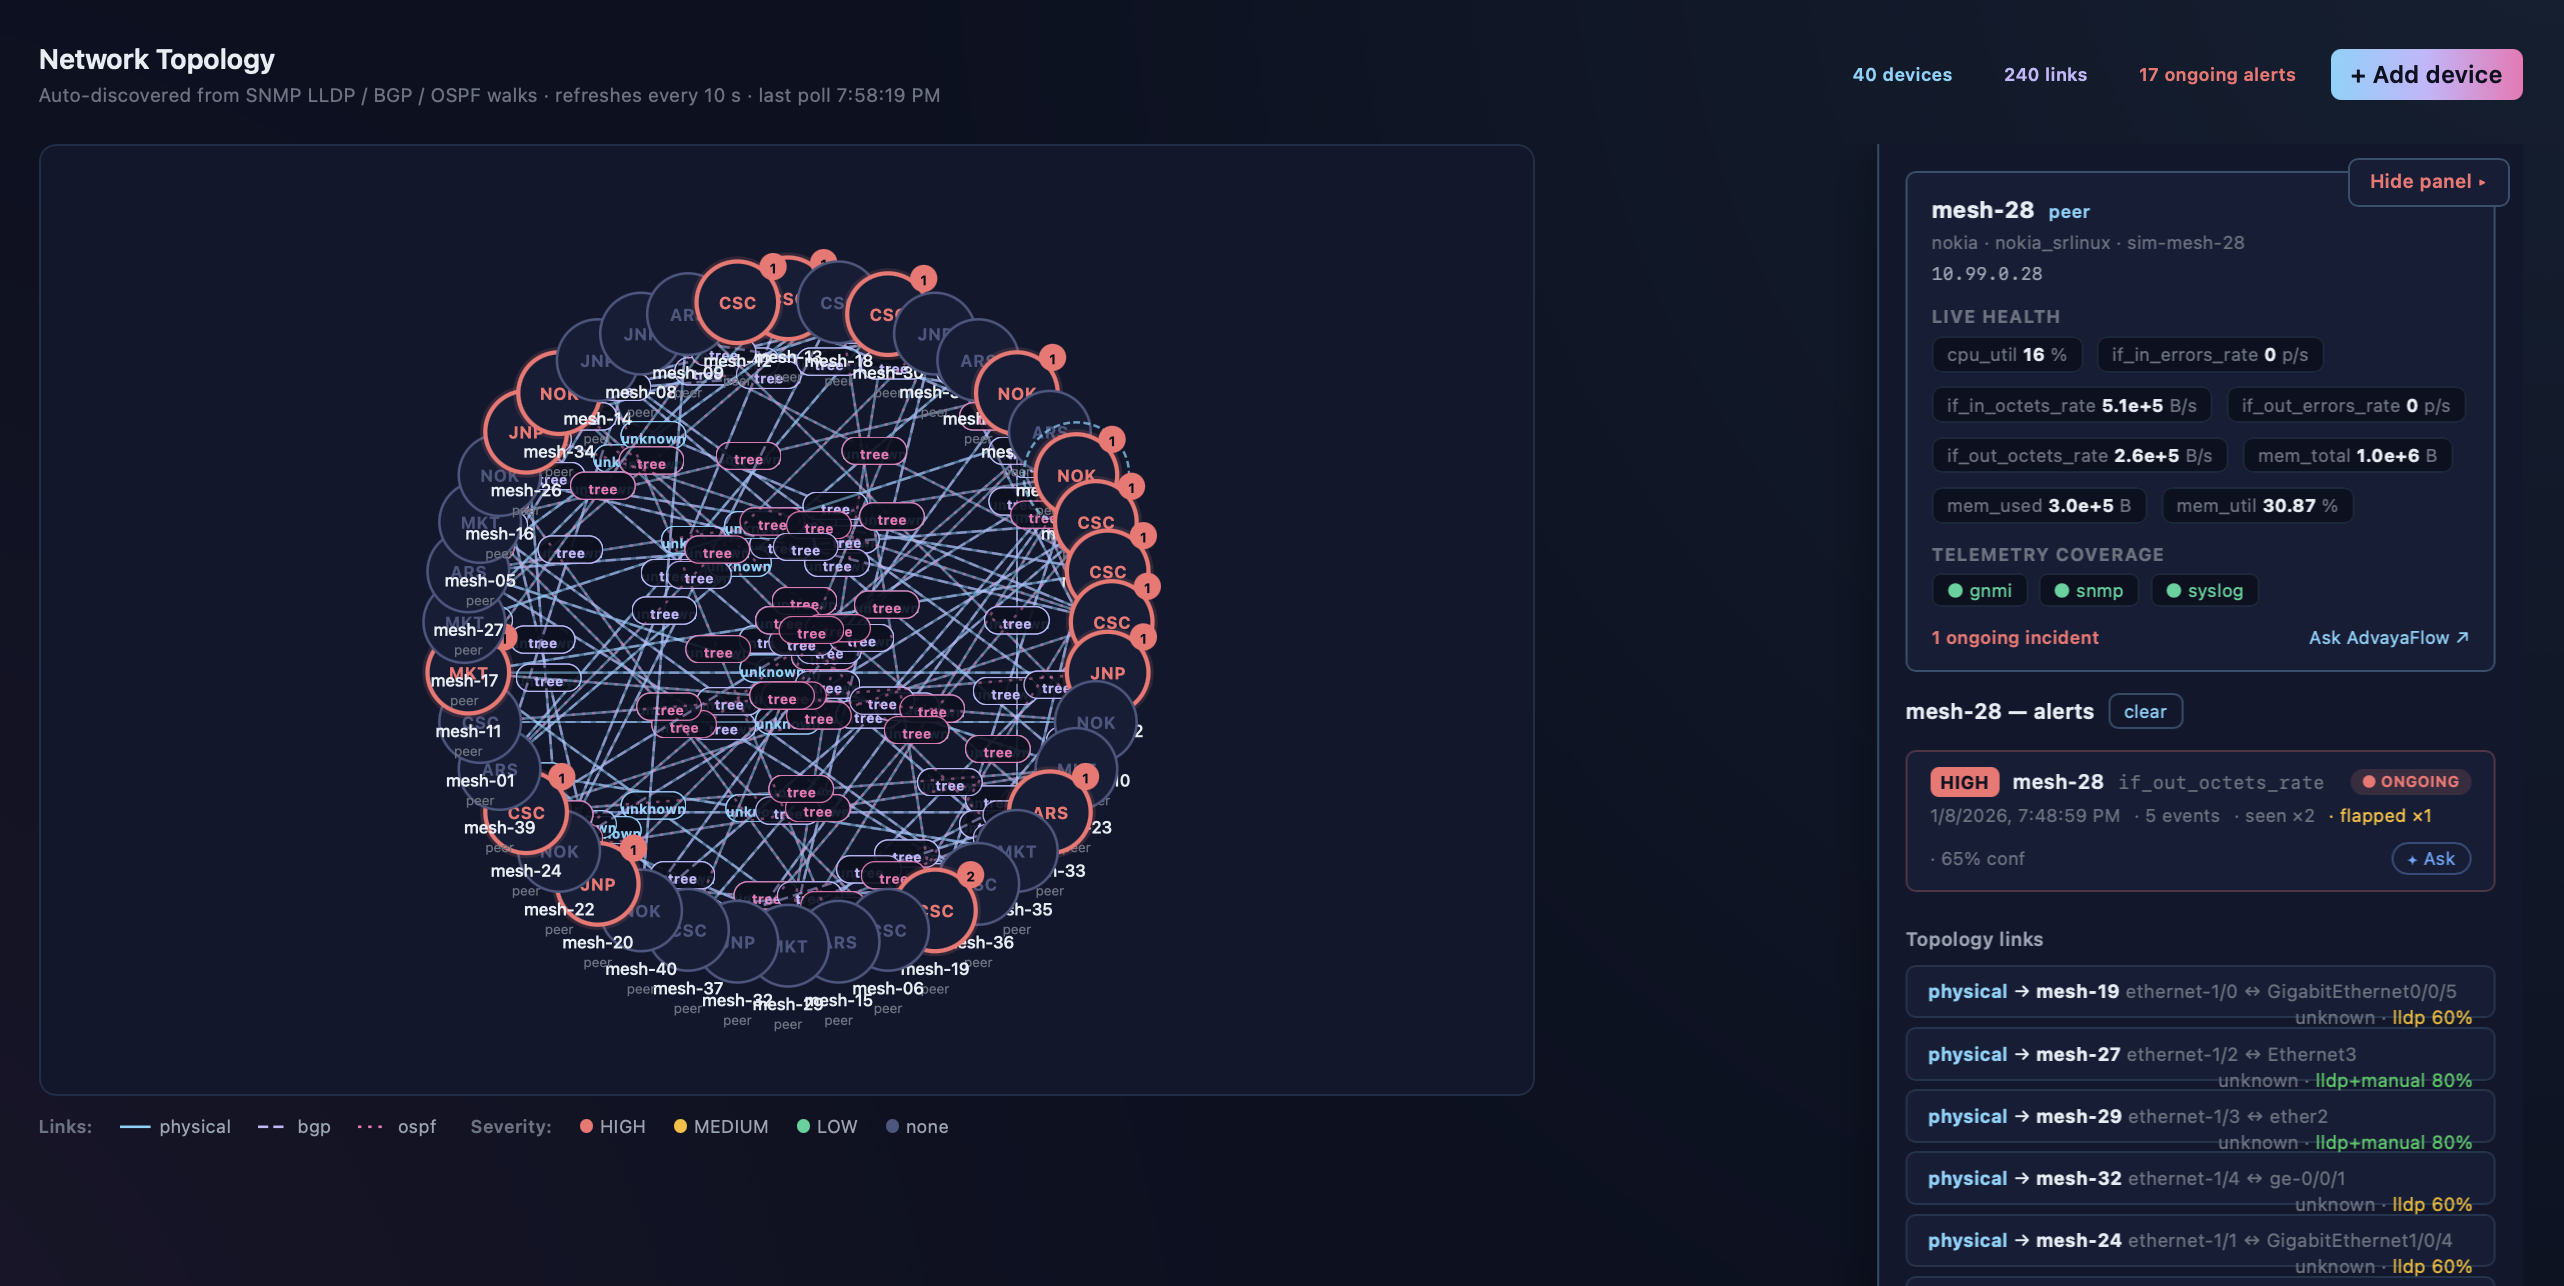
The map draws itself from SNMP LLDP, BGP and OSPF walks — dozens of devices and links, refreshed every few seconds. Click any node for live health, telemetry coverage and its active alerts; failing links light up by severity.
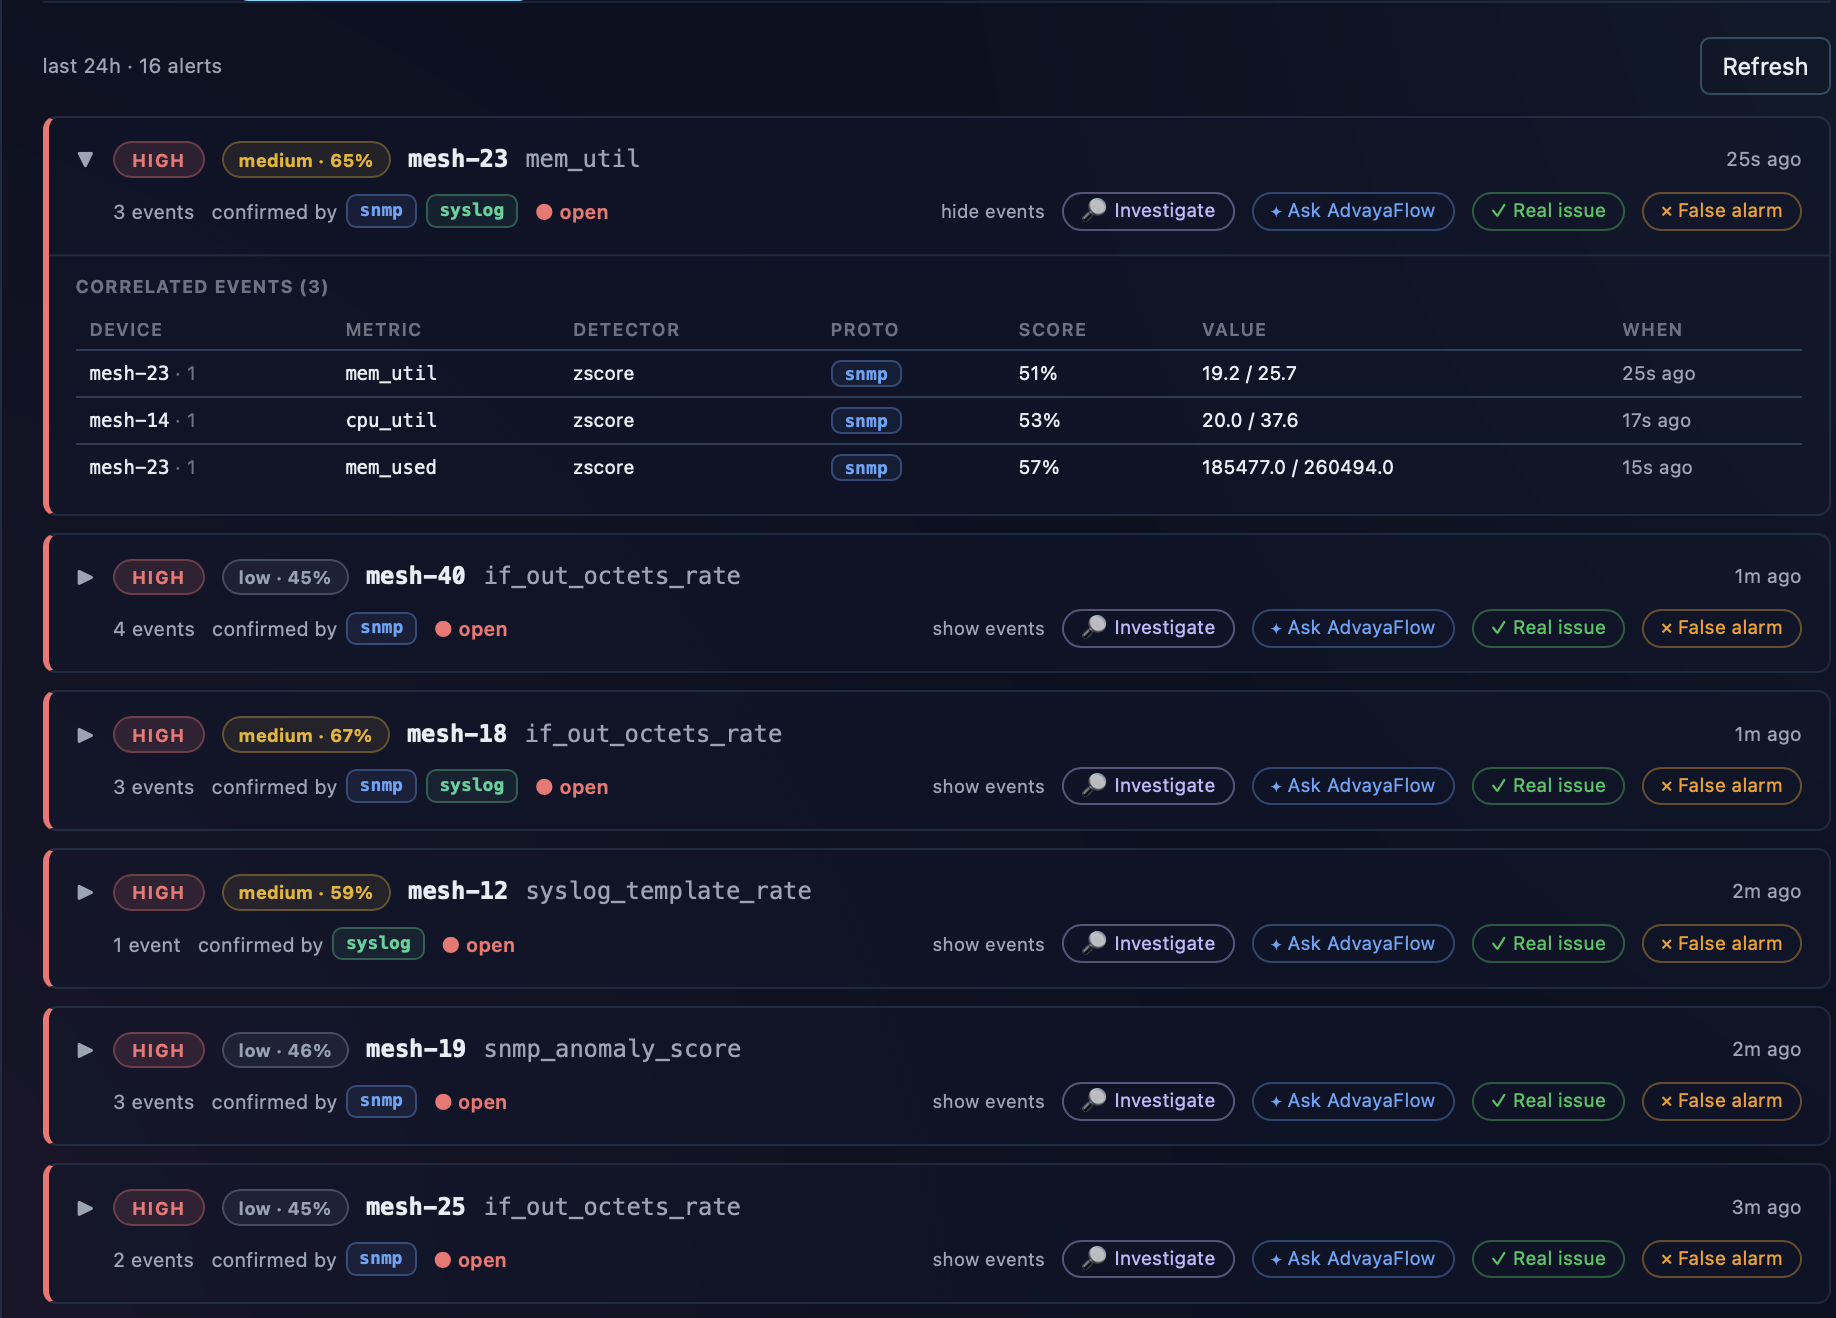
Related anomalies collapse into a single alert with a confidence score and the events that corroborate it across SNMP, gNMI and syslog. Investigate, ask the co-pilot, or mark it real / false — and that feedback tunes detection.
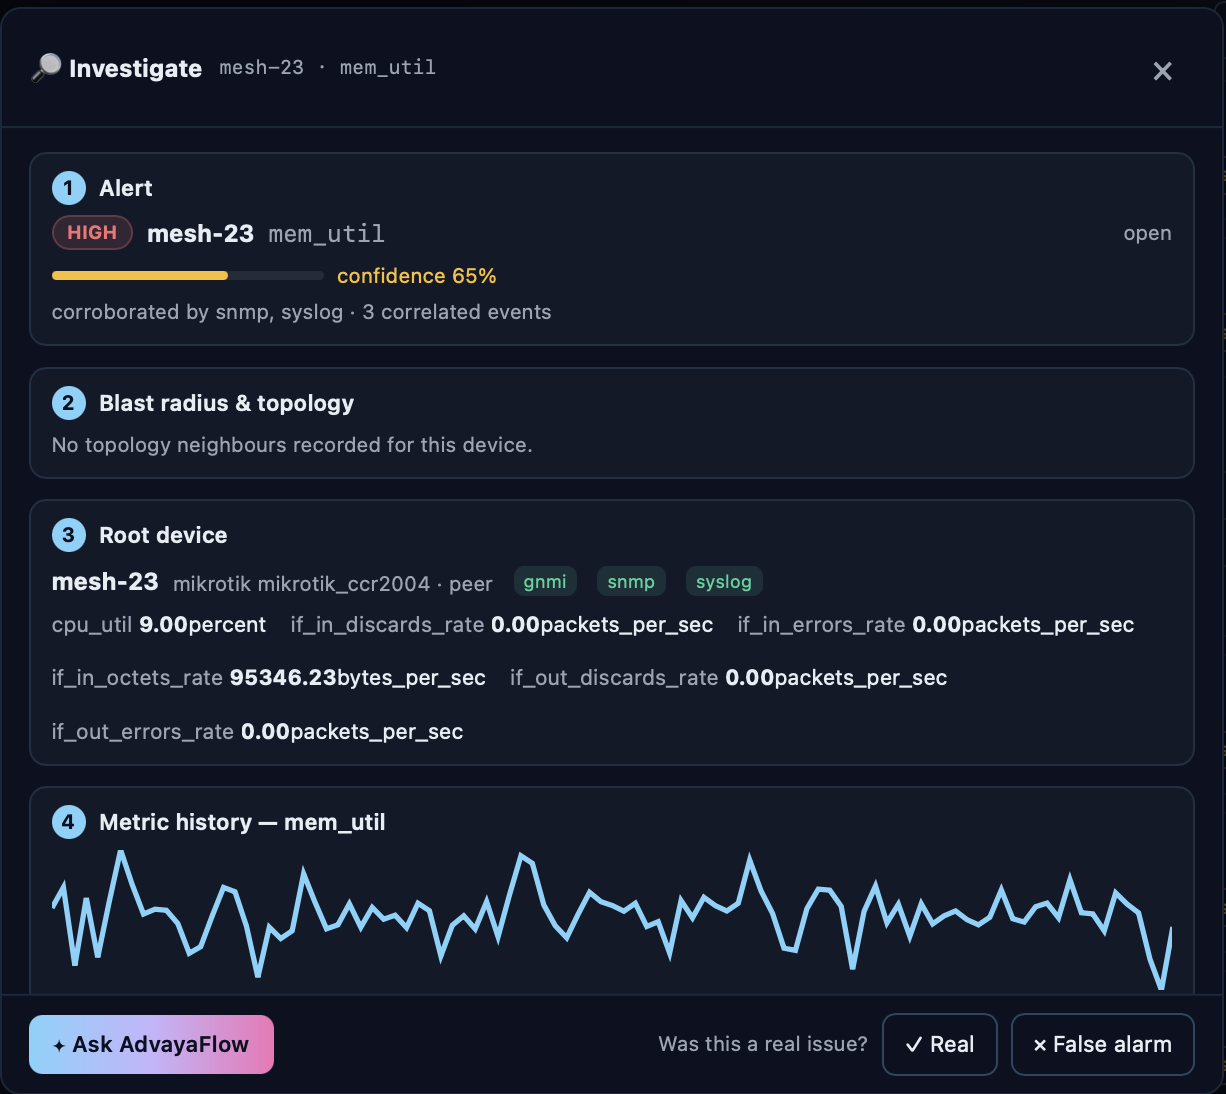
Every alert opens into the full picture — blast radius and topology, the root device and its live metrics, and the metric history behind the anomaly. One click to ask Advaya or confirm the verdict.
Your NMS tells you forty things broke. It won't tell you which one broke first. So an engineer opens six dashboards, SSHes into four routers, and reconstructs the topology from memory — at 2 a.m., every time.
And the tools that do solve this want your telemetry in their cloud.
Collect across the whole estate — SNMP, gNMI, NetFlow/sFlow, BMP, syslog — through one drag-and-drop pipeline. Route it where you need, or keep it entirely onprem.
An ensemble of detectors learns each network's normal rhythm and flags real anomalies early — without drowning your team in too many alarms.
AdvayaFlow understands how your devices connect, so it points to the likely root cause not fifty downstream symptoms and explains it in plain English/Hindi language.
Runs entirely inside your environment on self-hosted open models. No data egress, built for operators, data centres and sovereign networks that can't or won't use the cloud SaaS.
Deployed inside your environment. Your telemetry never leaves your network.
Point your devices at AdvayaFlow — running on your own infrastructure, on-prem or air-gapped.
It learns each network's normal behaviour, including daily and weekly rhythms.
Topology aware alerts that trace the causal path, not a wall of raw events.
The likely root cause in plain language, grounded in your raw telemetry.
Human approved remediation from inside the platform, once you trust the diagnosis.
Ask your network what's wrong in plain English/Hindi language. Advaya answers from your live telemetry and topology and helps you act on it. No external model API, no data leaving your perimeter.
What's wrong with the core mesh right now?
The mesh-03 → mesh-05 link is flapping — 14 up/down transitions in the last 5 minutes. It's the likely root cause of the 8 BGP alerts firing downstream on mesh-06…08. Blast radius: 3 devices. Want me to acknowledge the downstream alerts and flag the mesh-03/05 link for repair?
Every answer cites the real alert, device, interface and metric behind it, not a plausible sounding guess. If the evidence isn't there, Advaya says so.
Self-hosted open models, inside your perimeter. No external API, works fully air-gapped — your telemetry never becomes training data for someone else's model.
It reads across every protocol you collect and understands how your devices connect, so it explains cause and blast radius not just the symptom in front of you.
Acknowledge or resolve alerts straight from the chat, every action approved by you and written to an audit trail. (Human-approved remediation is coming next.)
Detectors tuned against real-world network traffic, not lab data. Fewer false alarms, real problems caught earlier.
A flat licence — no per GB and no per device metering. Growing your network never grows your bill.
Collection, detection, and root-cause in a single platform grounded in your raw telemetry, not a chatbot bolted onto a dashboard.
Collection, detection and inference all run inside your perimeter. No vendor tunnel, no external model API, no data-processing agreement to negotiate.
| Cloud-first observability platforms | AdvayaFlow | |
|---|---|---|
| Deployment | SaaS primary; on-prem available as an option | On-prem and air-gapped as the default design target |
| Vendor connectivity in on-prem mode | Managed deployments carry vendor access and connectivity requirements | No vendor tunnel, no callback, no phone-home |
| Pricing | Commonly per-device or per-volume metering | Flat licence |
| Data residency | Depends on deployment; SaaS default is vendor-controlled regions | Structurally solved — data physically cannot leave |
| Root cause | Cross-domain correlation | Topology-aware causal path |
Compared against the cloud first observability category generally, not a single named vendor.
If you run a network where downtime is expensive and your telemetry can't leave the building, we'd like to show you AdvayaFlow.
Request a demo